The feedback dashboard
The feedback dashboard gathers your guests’ responses to the satisfaction survey.
FeedbackIt fills up once the survey is turned on — see Configure the satisfaction survey. Until a response arrives, the page shows “No responses yet”.
The period metrics
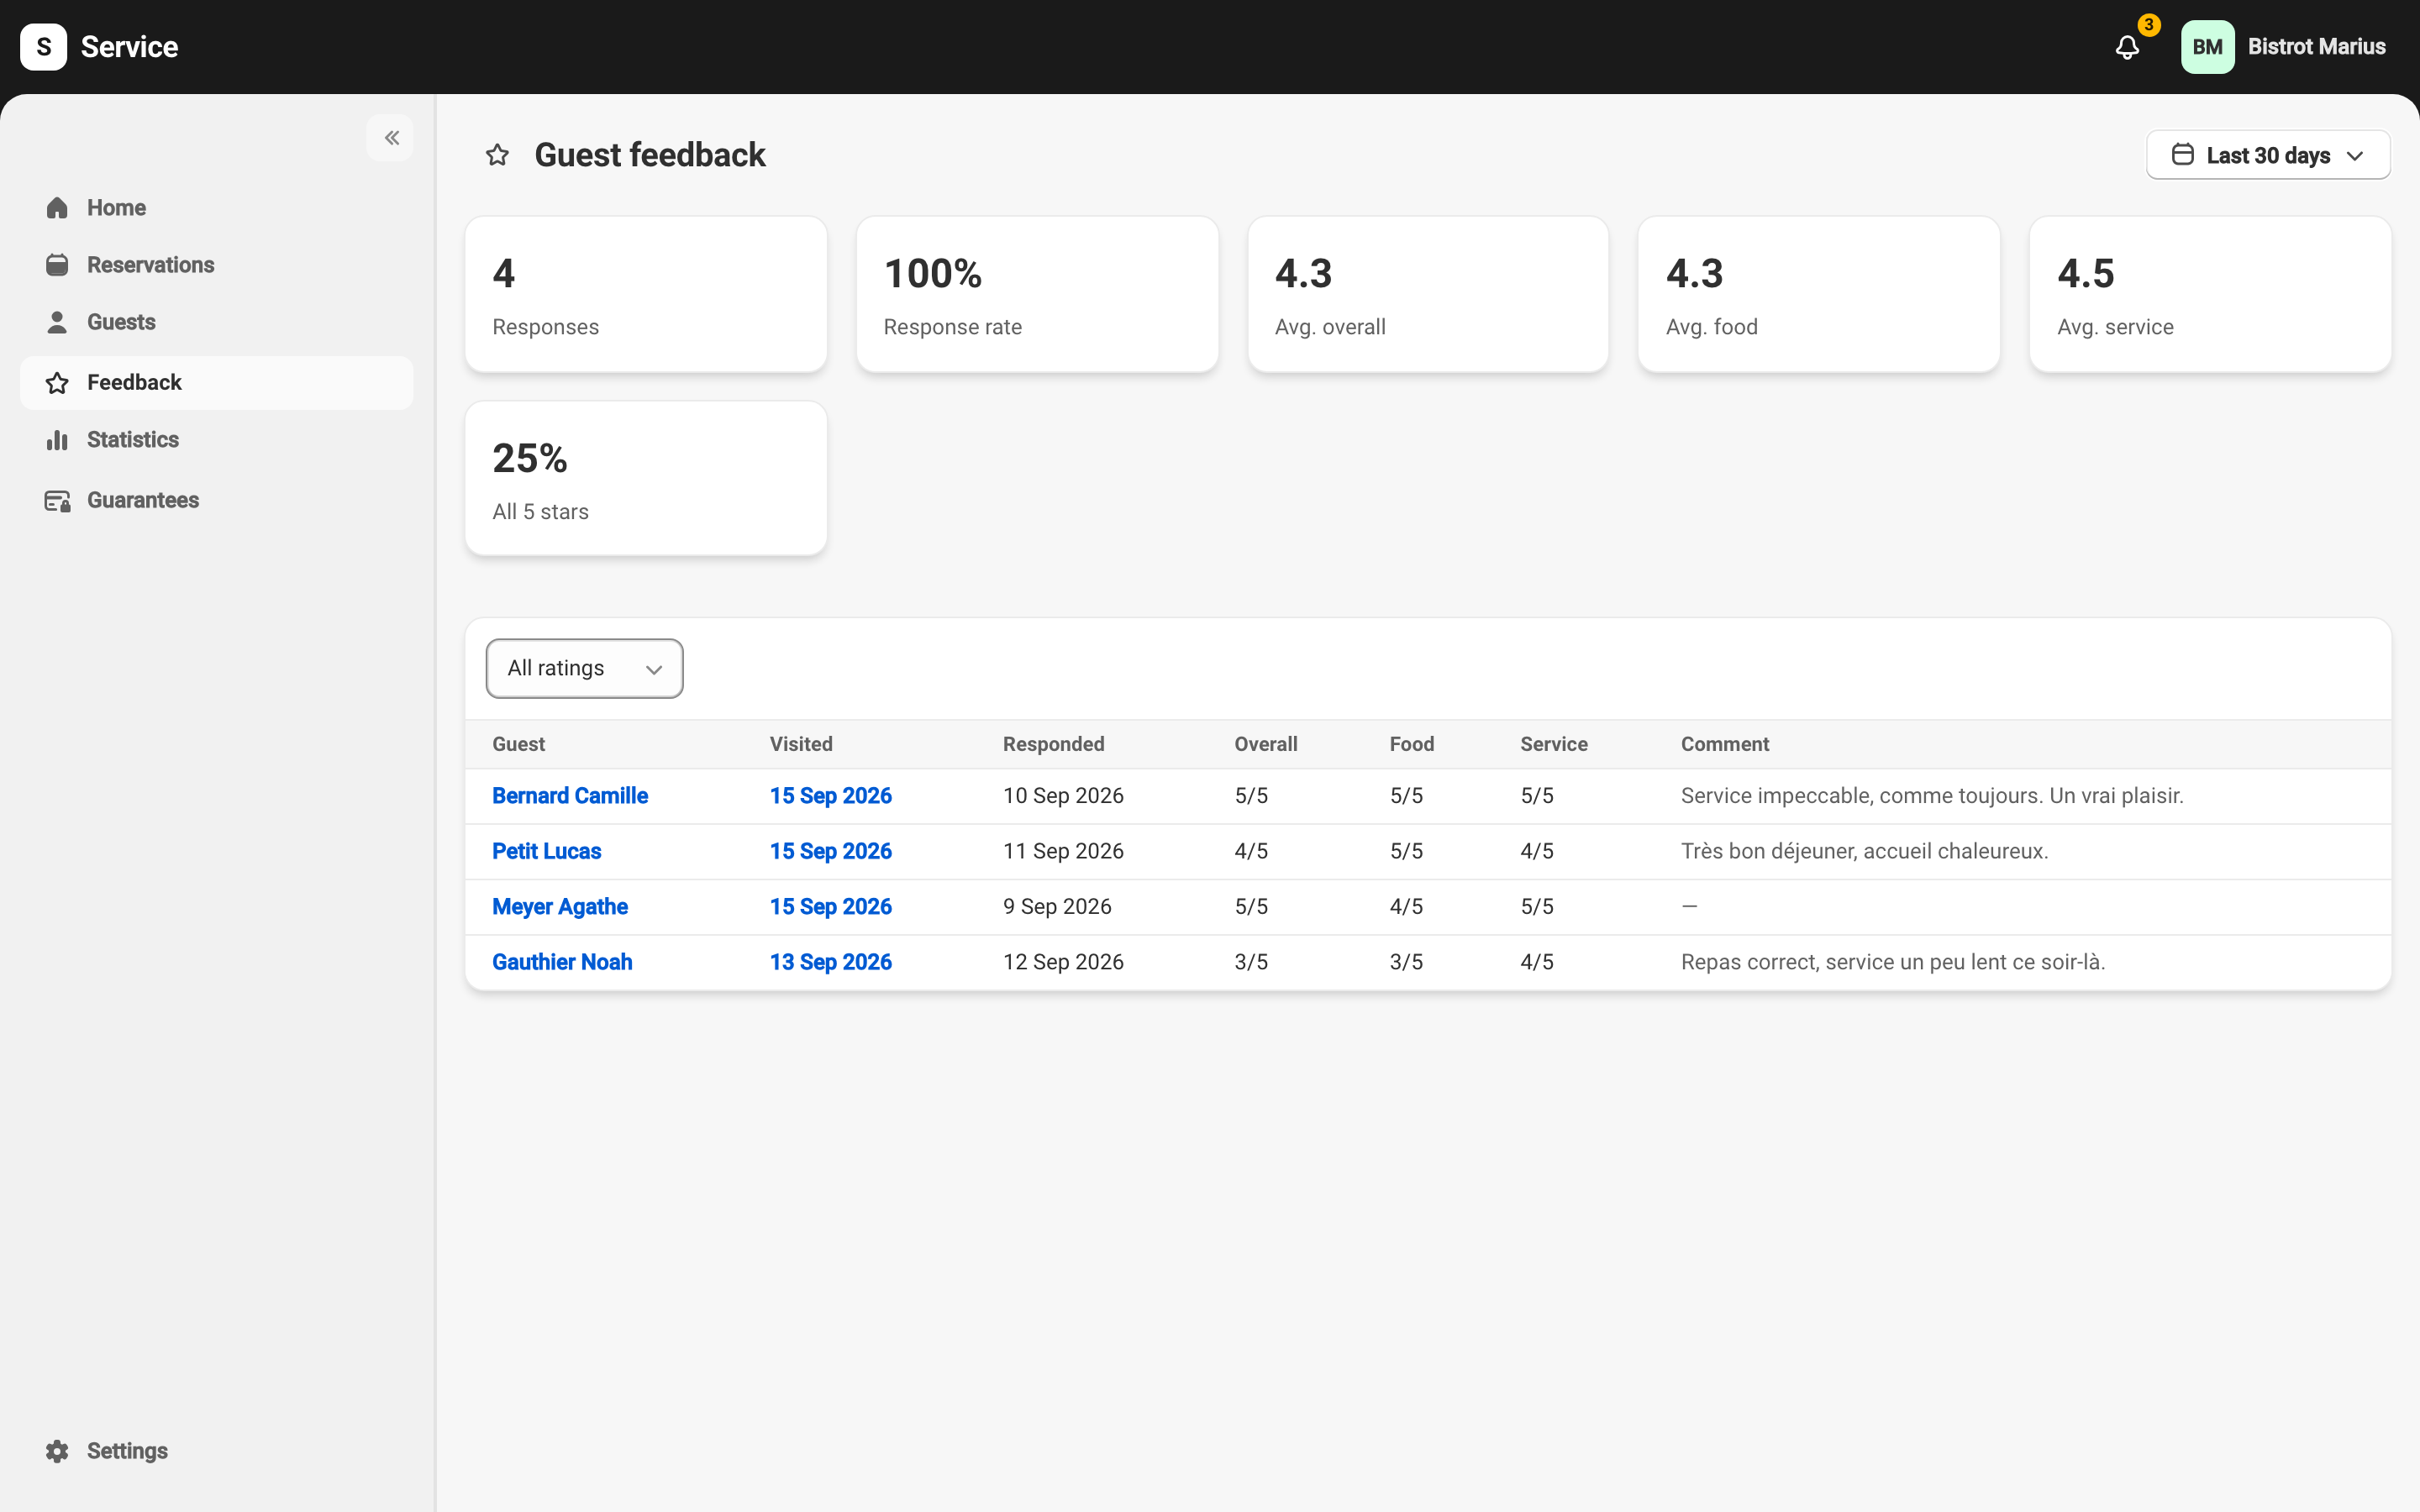
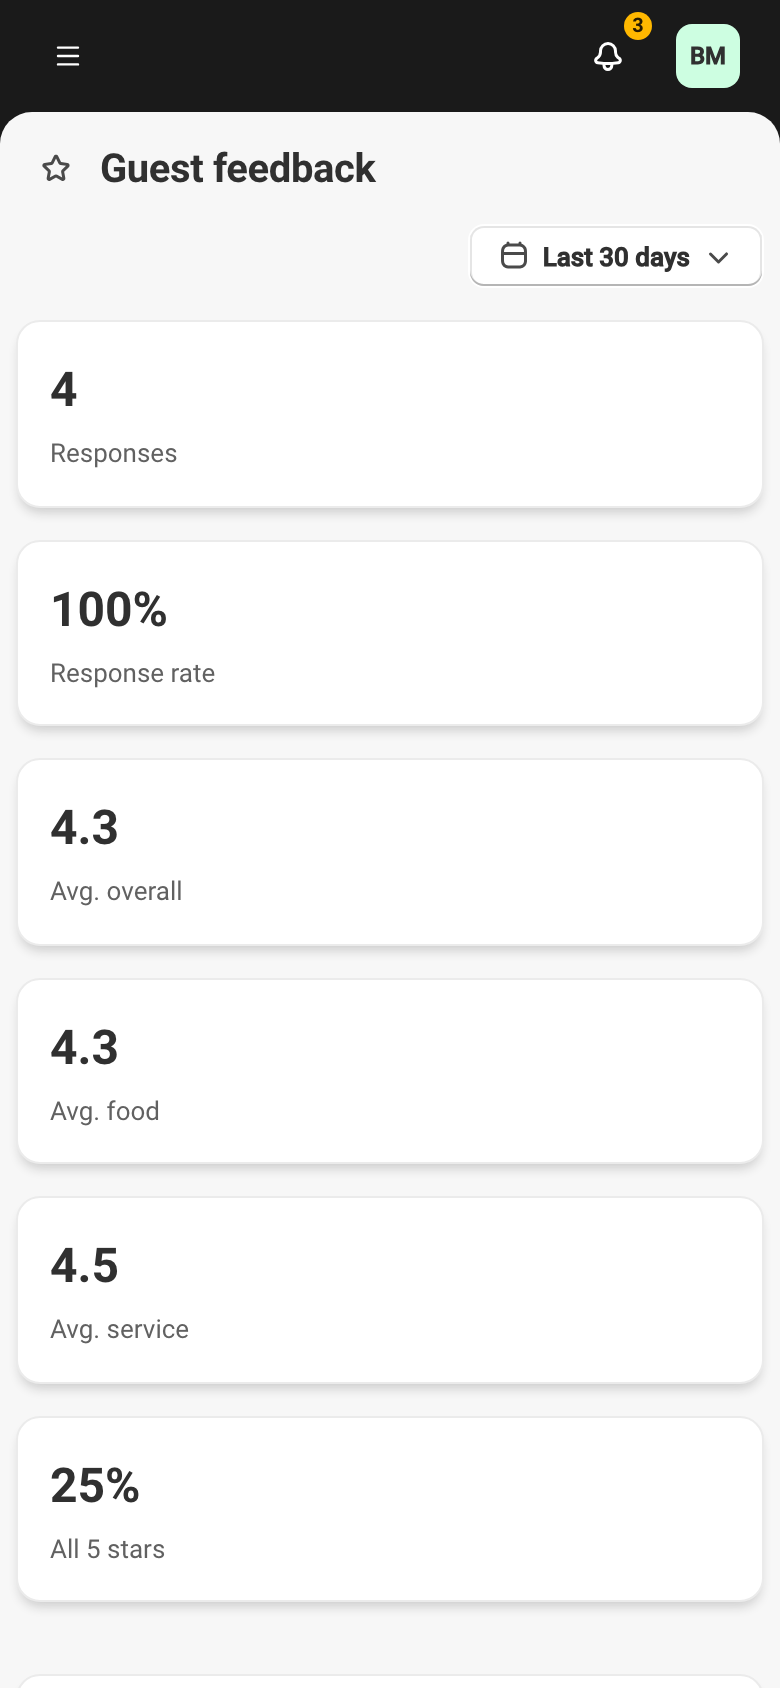
Section titled “The period metrics”Six cards summarise the chosen period:
- Responses — the number of responses received.
- Response rate — the share of surveys sent that got a response.
- Avg. overall, Avg. food, Avg. service — the average rating out of 5 for each of the three rated categories.
- All 5 stars — the share of responses that gave the top rating in all three categories.
The date-range picker, at the top of the page, sets the window these metrics and the table are computed over.
The response table
Section titled “The response table”Each response takes one row, with the Guest, the Visited date, the Responded date, the Overall, Food and Service ratings, and the Comment the guest left. Ratings show out of 5; an empty cell in the Comment column marks a response with no comment.
The guest name links to their guest profile. The visit links to the reservation it came from. Responses are shown 25 per page.
Surface the responses to act on
Section titled “Surface the responses to act on”The rating filter, above the table, narrows the list:
- All ratings — no filter.
- To improve — the responses where at least one rating is below 5, the ones worth attention.
- ≥ 4★ overall — the responses whose overall rating is at least 4.
- 5★ only — the perfect responses alone.
From the satisfaction tab of the statistics, the block of responses to act on links straight to this table, filtered on To improve.
When a “feedback received” notification brings you here, the table opens on that single response, marked with a tag. Remove the tag to return to the full list.
For what the guest receives and how they reply, see What the guest receives.