Feedback statistics
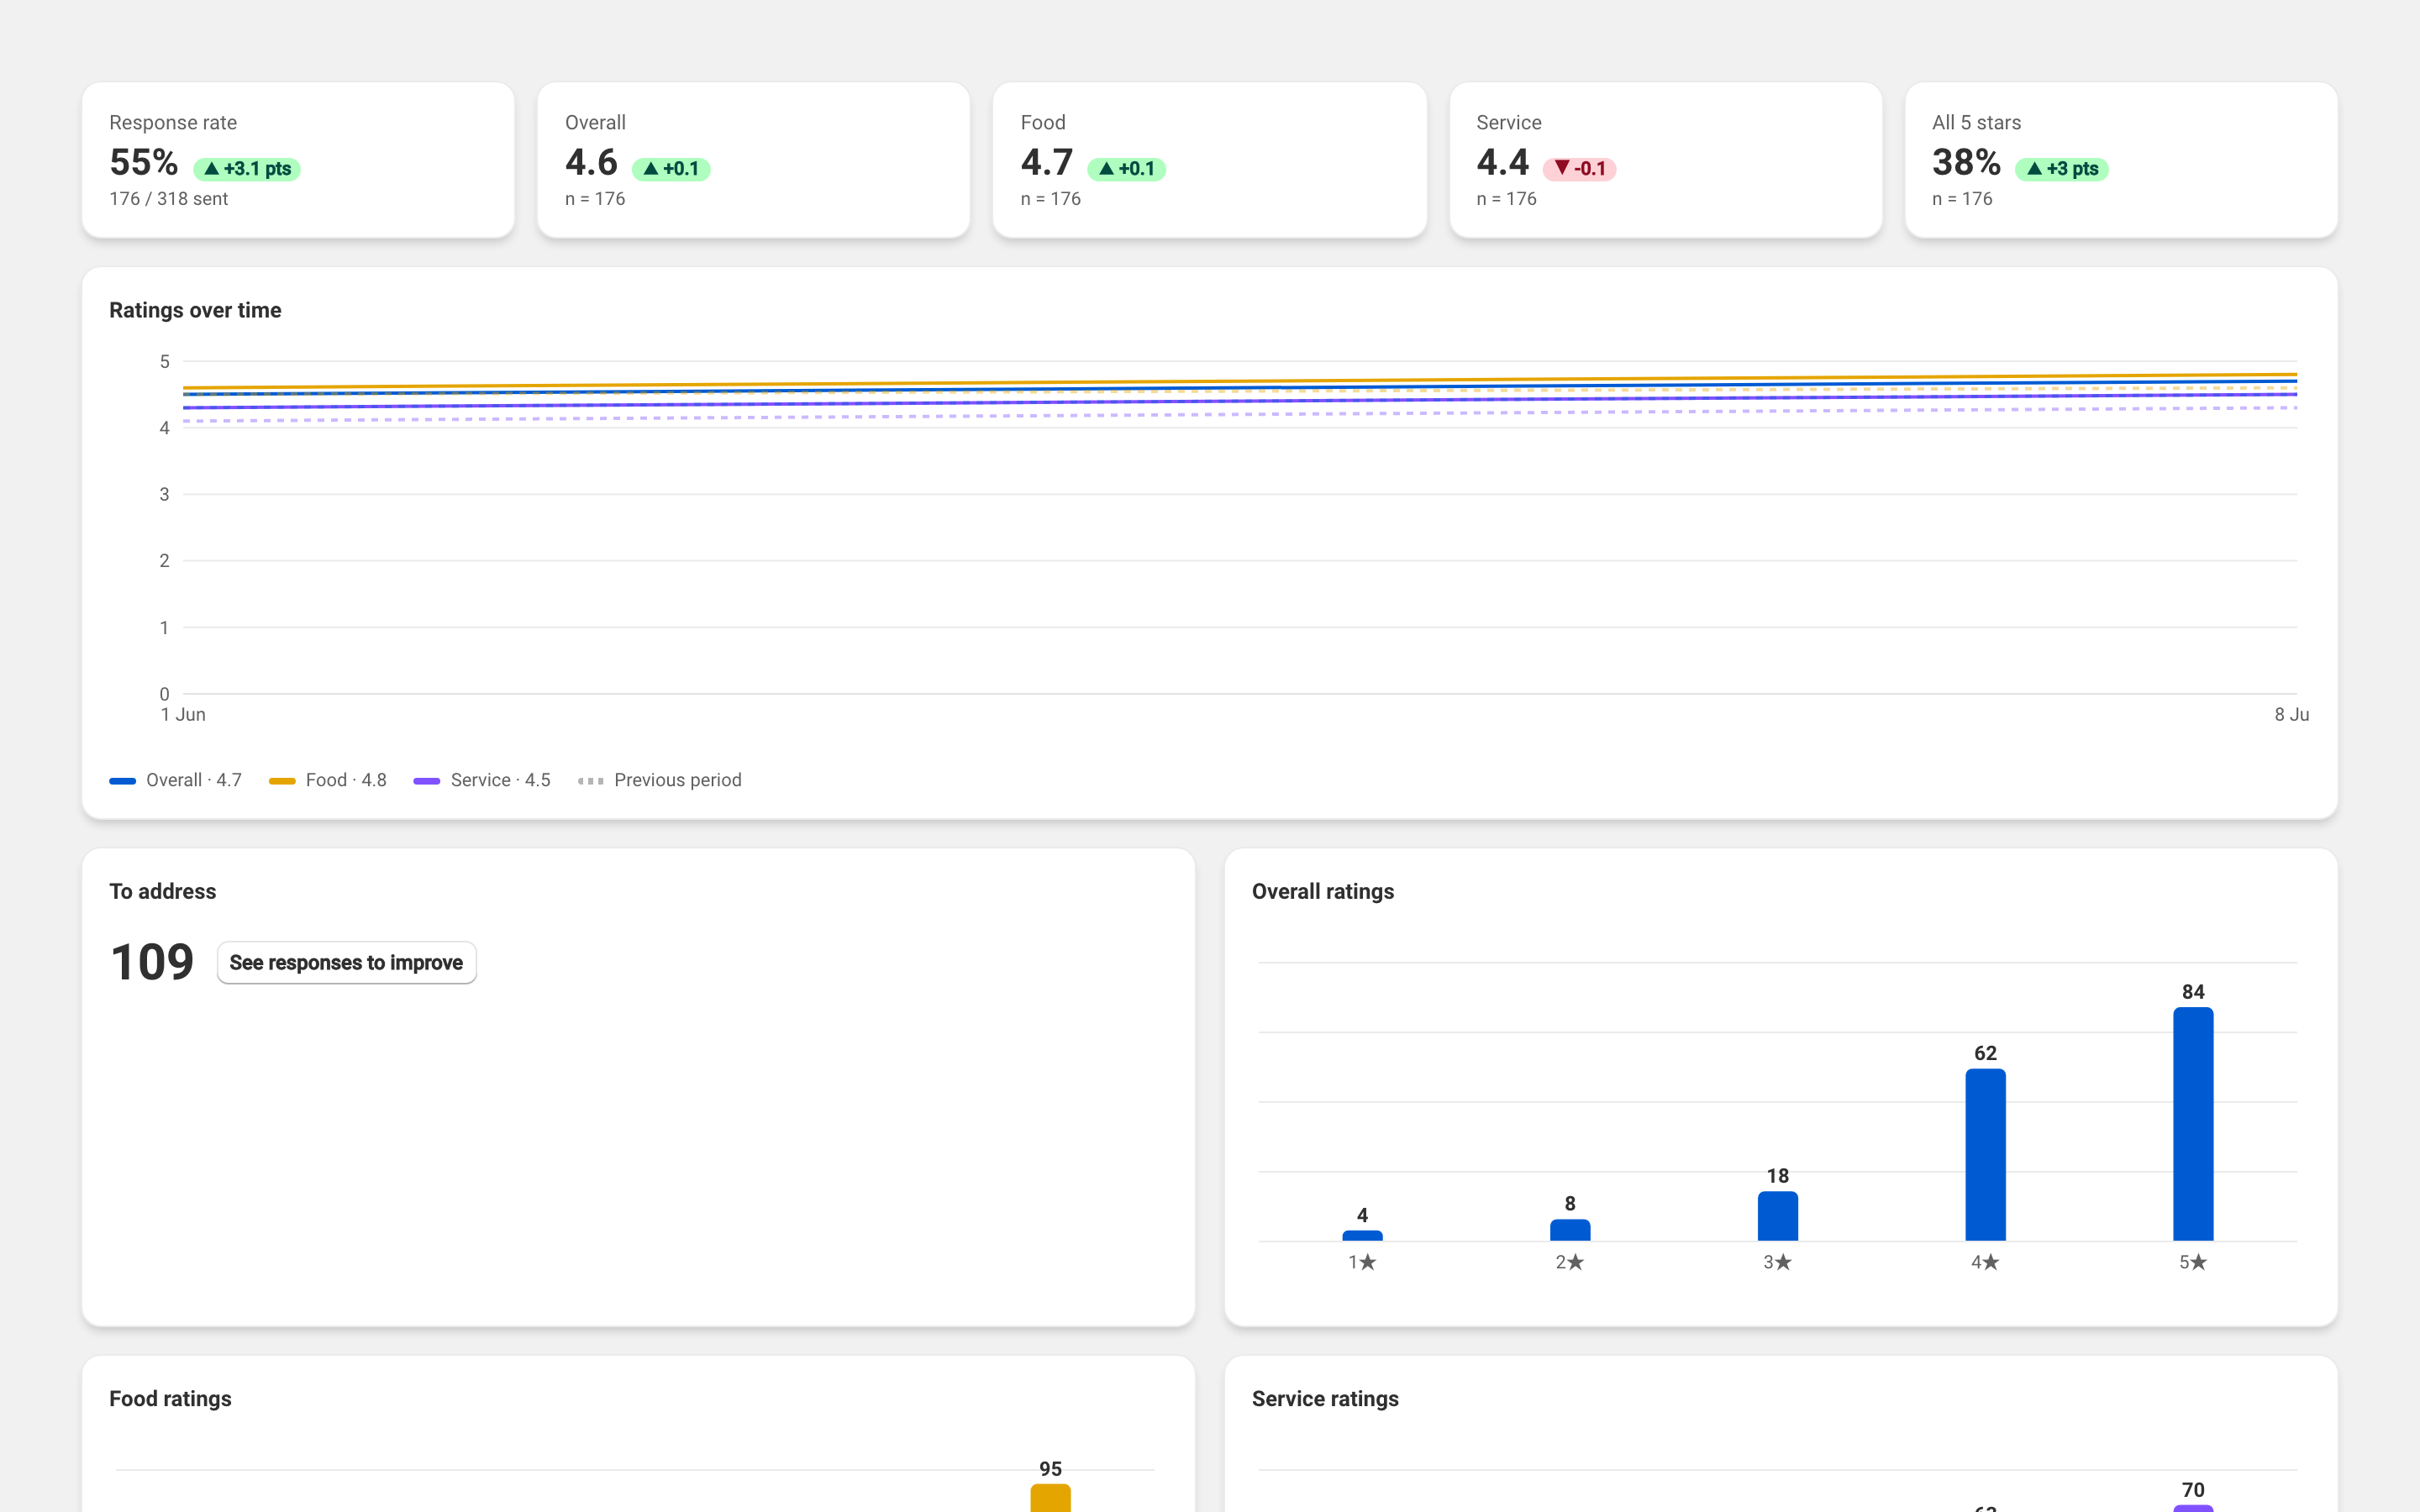
The satisfaction page (StatisticsSatisfaction) sums up the feedback your guests leave after their visit: the response rate, the average ratings and the responses that need a reply.
These figures come from the satisfaction survey sent after the visit. The period and comparison sit at the top — see Choosing the period and comparing.
The key metrics
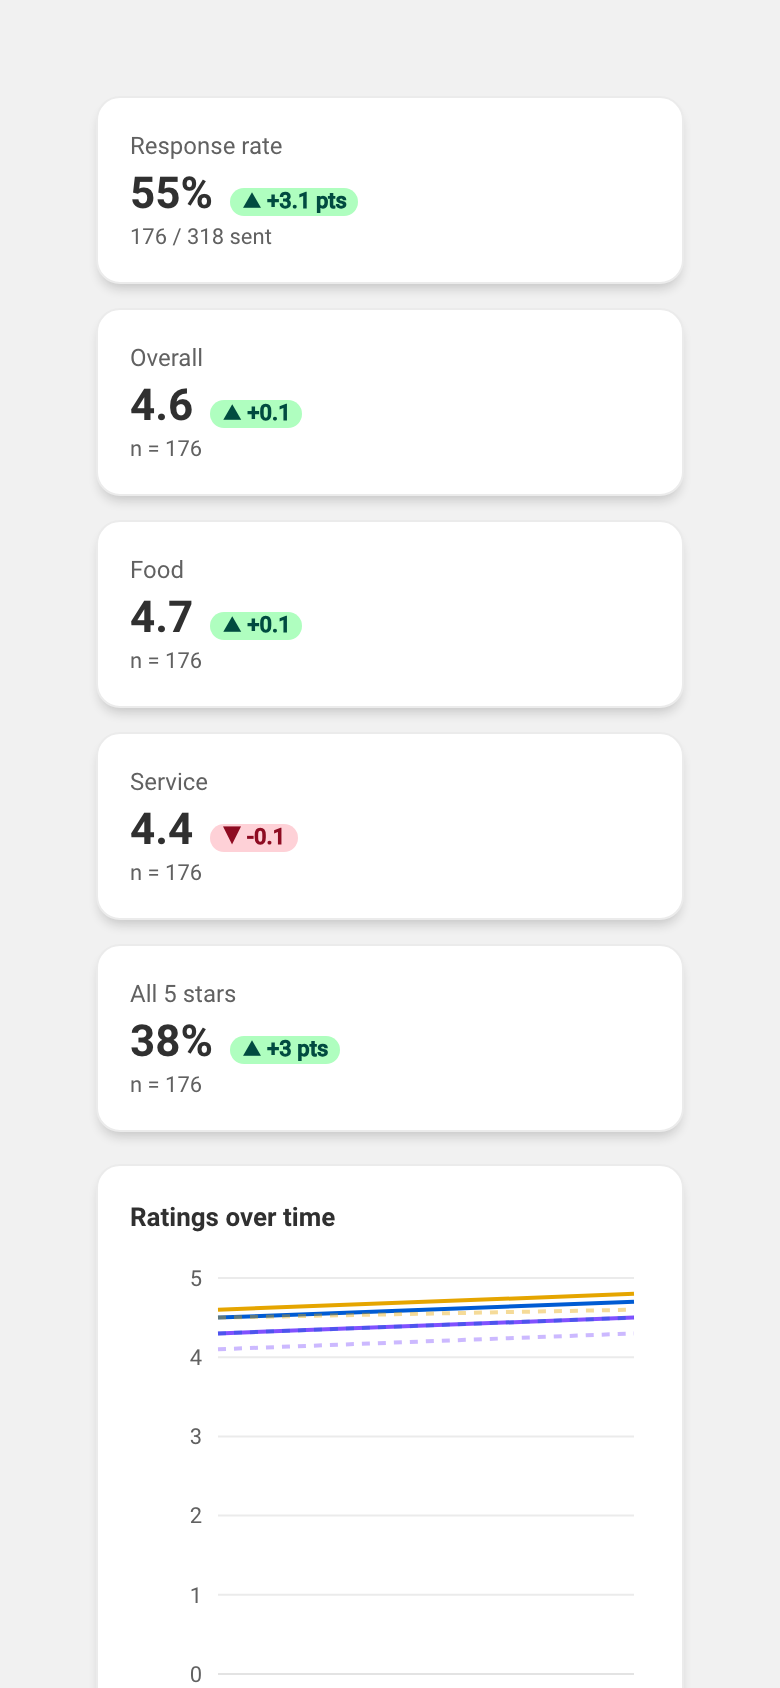
Section titled “The key metrics”- Response rate — the share of surveys sent that the guest answered. The number of responses over the number sent is noted below.
- Overall, Food and Service — the average ratings, out of five, for each of the three criteria.
- All 5 stars — the share of responses rated five out of five on all three criteria at once.
The average ratings and the all-five-stars share are hidden below five responses; the response rate is hidden below five surveys sent — see Hidden values.
Ratings over time
Section titled “Ratings over time”Ratings over time plots the weekly trend of the three average ratings, on a 0 to 5 scale.
To address
Section titled “To address”To address counts the responses not rated five everywhere — those where at least one criterion is below five. The See responses to improve button opens those responses in the feedback page, ready to handle.
Rating distribution
Section titled “Rating distribution”Three histograms — Overall ratings, Food ratings and Service ratings — count responses by value, from one to five stars.
By service
Section titled “By service”The By service table gives the three average ratings and the number of responses for each of the day’s services.
By weekday
Section titled “By weekday”By weekday compares the average overall rating across days, to spot the weaker ones.