Your venue's activity
The Activity page is the first of the statistics (Statistics). It measures the volume and quality of service over the chosen period: how many covers served, how many reservations, what occupancy and at what times.
The period, comparison, grouping and filters sit at the top and are shared across the three pages — see Choosing the period and comparing.
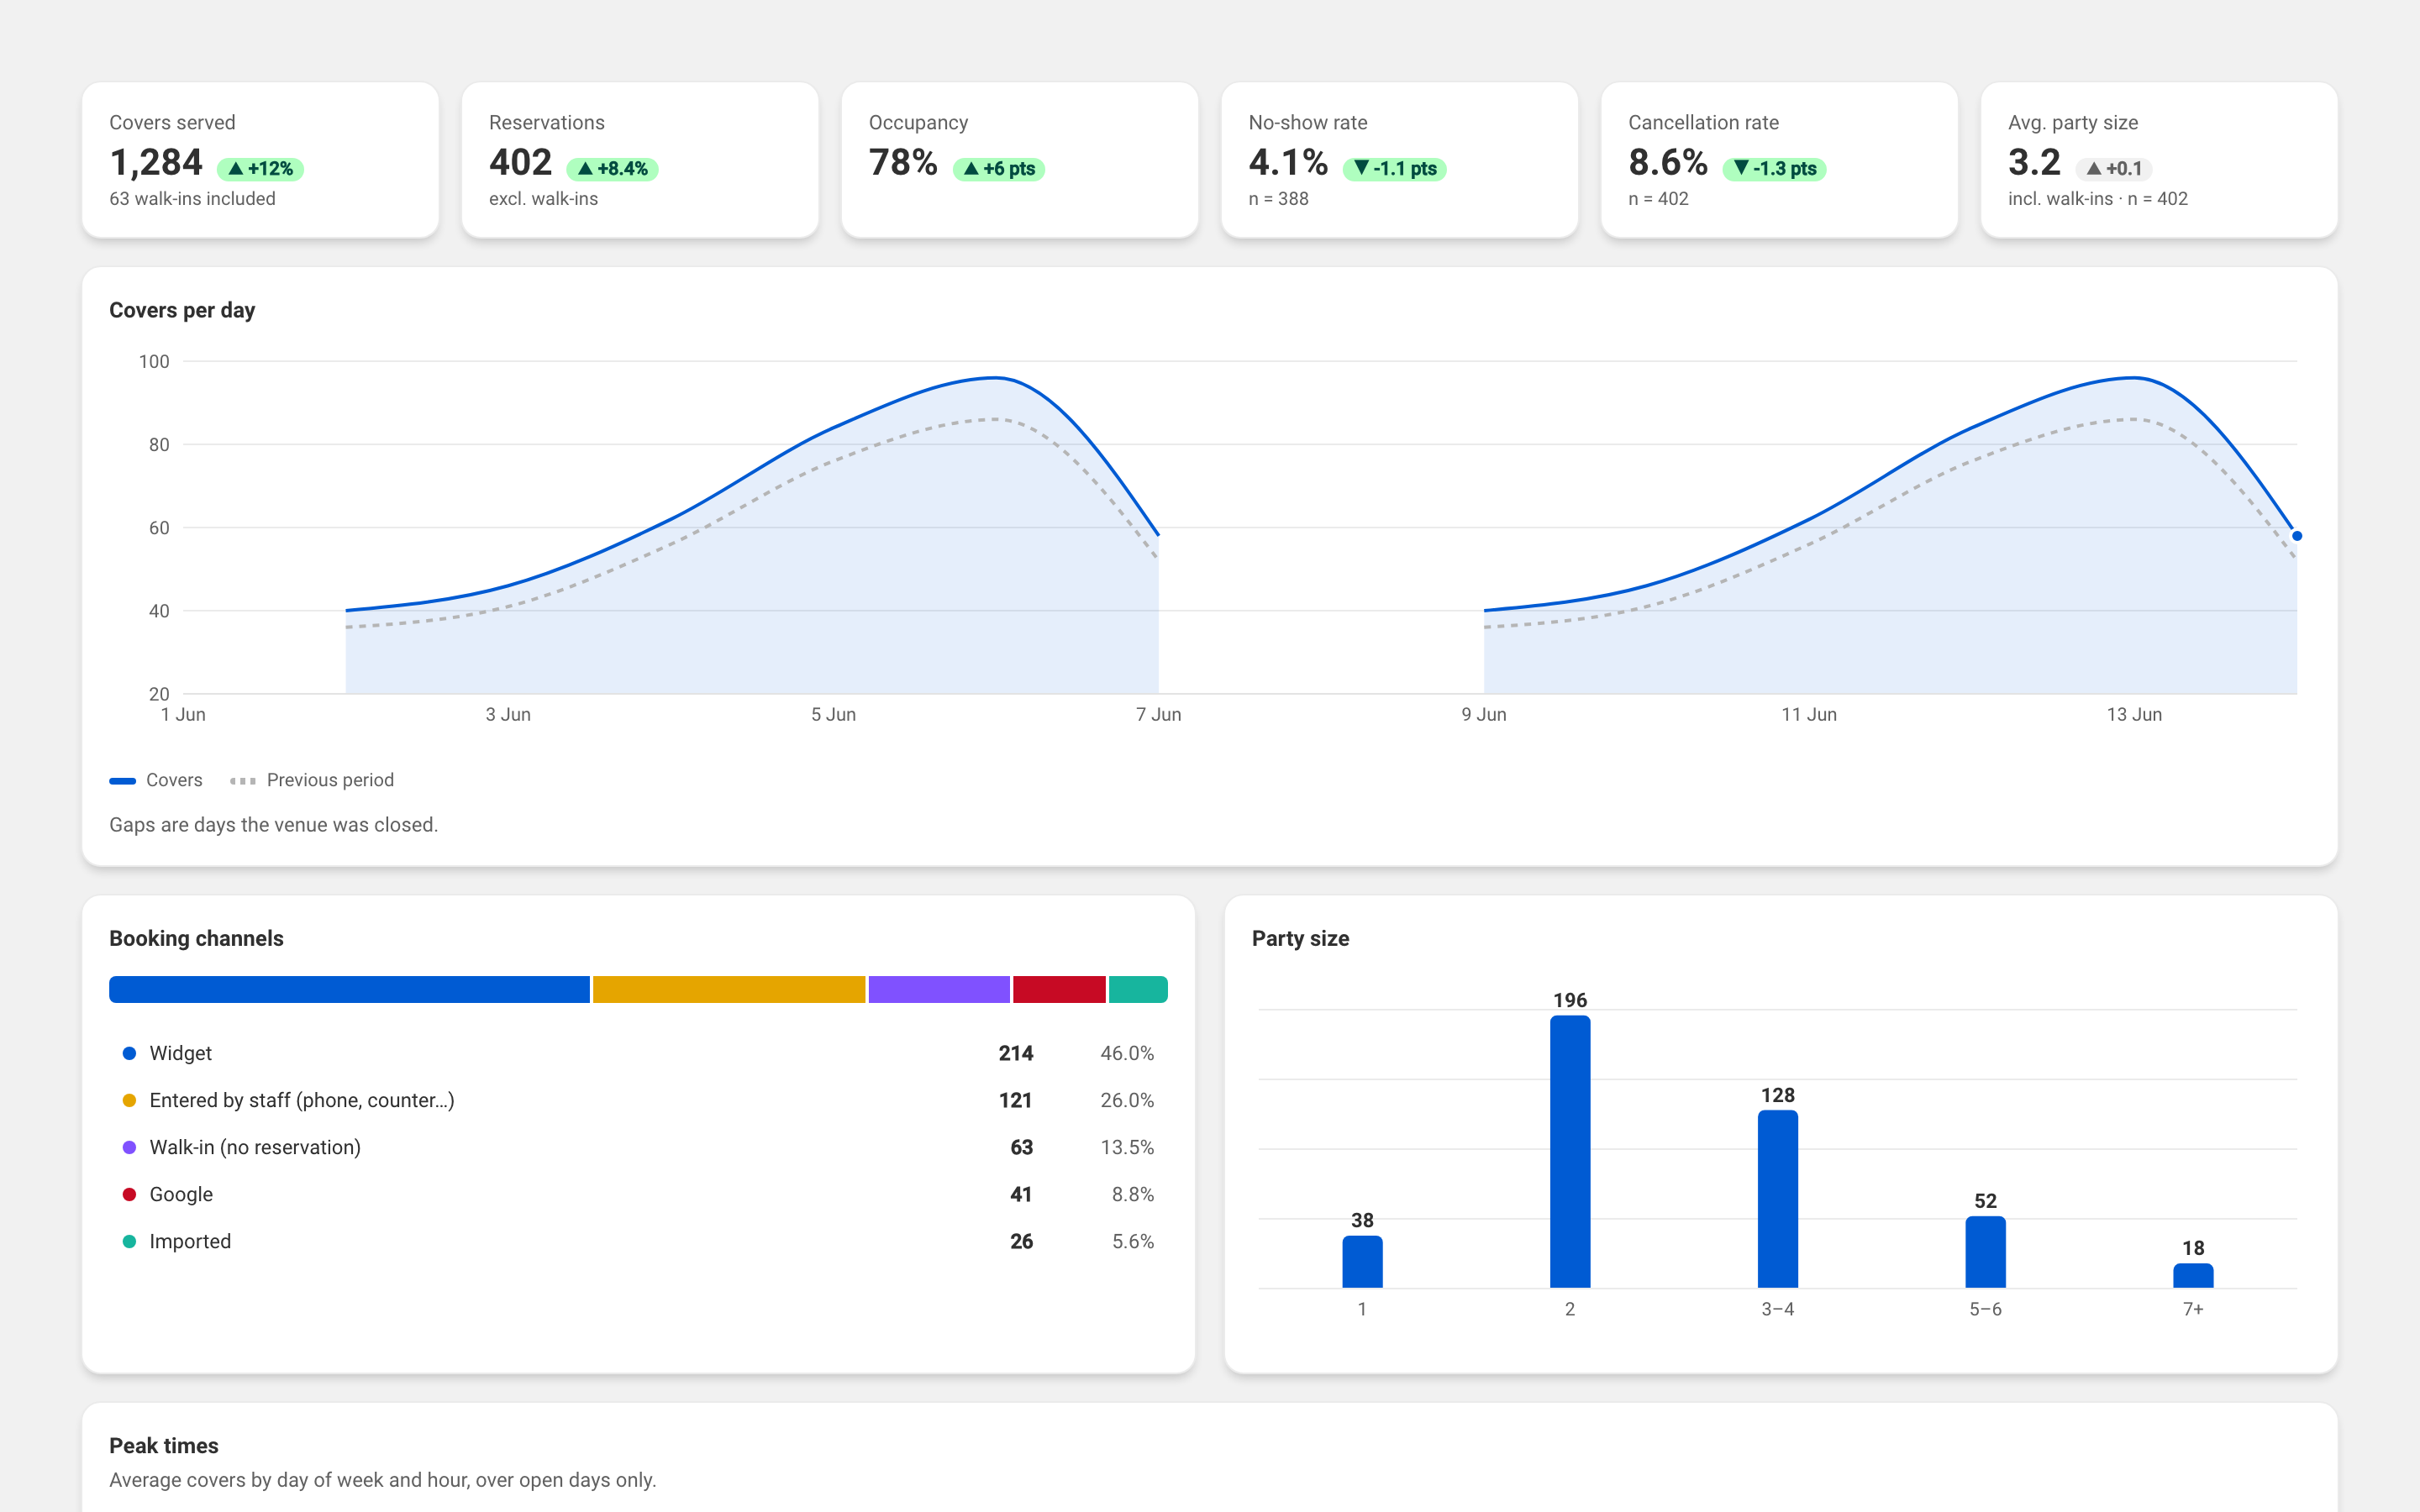
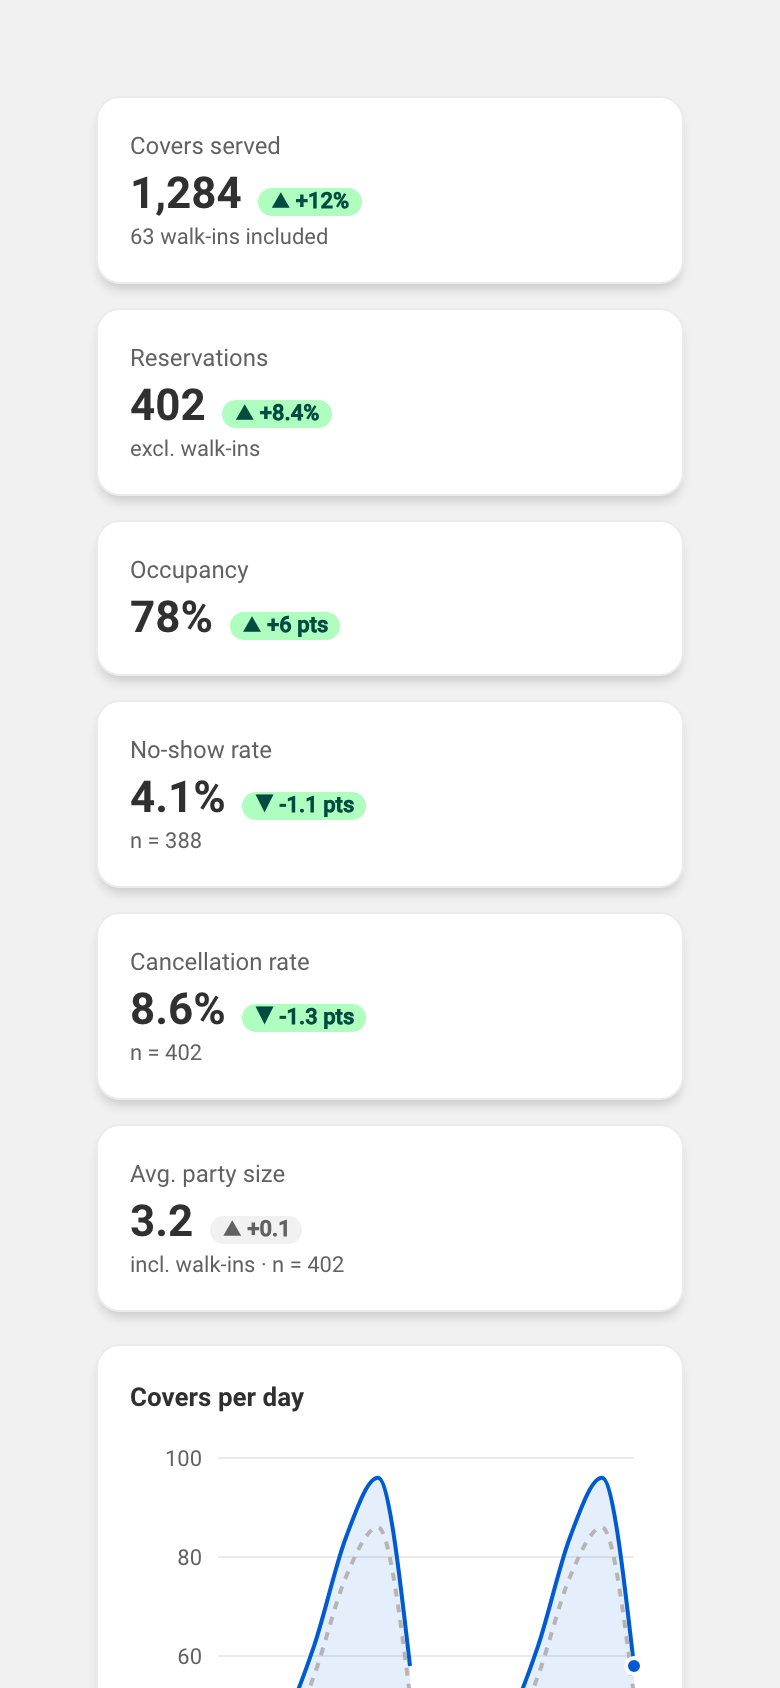
The key metrics
Section titled “The key metrics”The top row sums up the period in six figures:
- Covers served — the number of covers actually served, walk-ins included. The number of walk-ins included is noted below.
- Reservations — the number of reservations, excluding walk-ins.
- Occupancy — the share of your capacity used. Shows Capacity not set until a capacity is entered.
- No-show rate — the share of reservations where the guest did not turn up.
- Cancellation rate — the share of reservations that were cancelled.
- Avg. party size — the average number of covers per reservation, walk-ins included.
The no-show rate, the cancellation rate and the average party size are hidden below five reservations — see Hidden values. A no-show is the No-show status of a reservation, a cancellation the Cancelled status: see Reservation statuses.
Covers per day
Section titled “Covers per day”The Covers per day chart plots covers served over time, at the step chosen in Group by. Gaps in the line are days the venue was closed. With a comparison active, the reference period appears as a second line.
Booking channels
Section titled “Booking channels”Booking channels splits reservations by where they came from — the widget, entries by your team, the phone, Google, imports… These are the same channels as the Channel filter.
Party size
Section titled “Party size”Party size counts reservations by number of covers, in five bands: 1, 2, 3–4, 5–6 and 7 or more.
Peak times
Section titled “Peak times”Peak times is a heatmap of average covers by day of week and hour, computed over open days only. The darkest cells are the busiest slots.
By service
Section titled “By service”The By service table shows, for each of the day’s services, covers served, occupancy, the no-show rate and the average party size. Unresolved reservations in the period — with no service attached — are flagged under the table and left out of the rates.
Booking lead time
Section titled “Booking lead time”Booking lead time shows how far ahead your guests book, in five bands: same day, one day ahead, 2–7 days, 8–30 days and more than 30 days. The median is noted at the top of the chart.